AINN
Get a Quote
AINN
During R&D, factory inspection and performance validation of pumps, motors, valves and other hydraulic components...
During R&D, factory inspection and performance validation of pumps, motors, valves and other hydraulic components,Hydraulic Test BenchMeasuring pressure, flow, speed and torque is not enough. The data from each duty point has to be recorded in sequence, so the curve reflects how the product actually works.
So how is a complete hydraulic performance curve produced?
Before a test starts, parameters are set for the product. A pump is typically checked for pressure, flow, speed, volumetric efficiency and power. A motor also needs torque and speed.
The bench steps pressure, flow or speed through a set program so the component covers the full range from light load to rated duty.
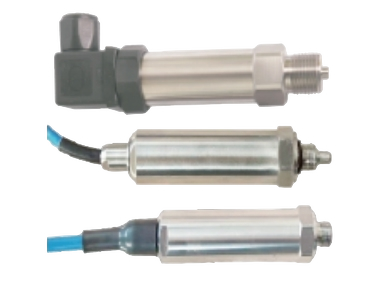
The bench watches the system in real time through pressure sensors, flow meters, and temperature, speed and torque sensors.
During the test, every channel is sampled on one time base, so parameters stay aligned and later analysis rests on reliable data.
A performance curve is not made from a single test point.
During a test, the control system steps the load through a preset sequence and, at each stable point, records pressure, flow, temperature, speed, torque and related values. Consecutive points show how the component behaves across its working range.
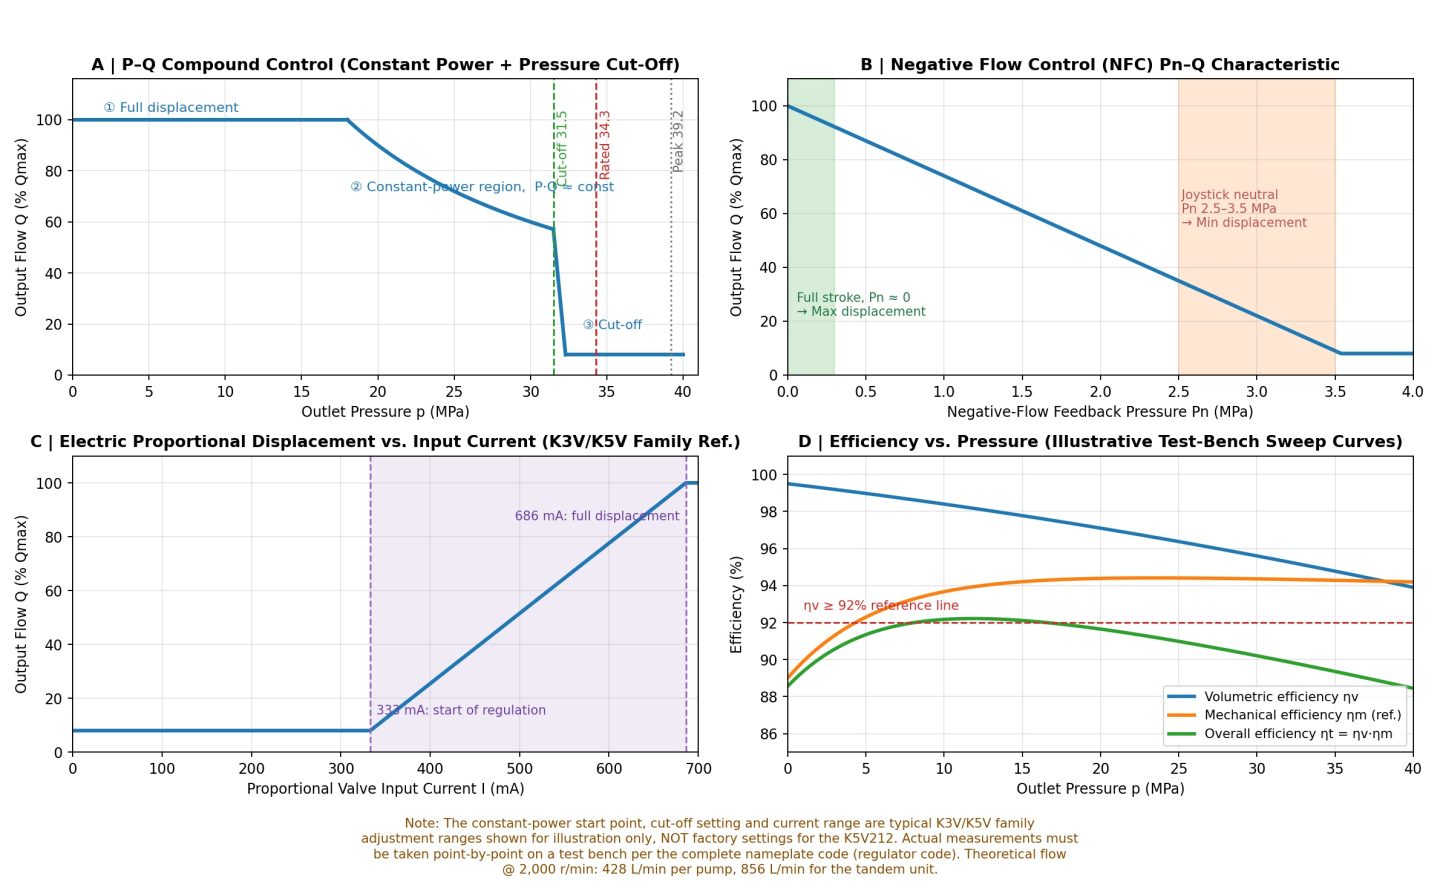
When testing a pump, outlet pressure can be raised step by step while actual flow is recorded, producingPressure–flow performance curve。
After acquisition, the bench software organizes and calculates the raw data, then draws the curves for the test, for example:
The curve shows how performance changes with duty, and helps engineers spot falling flow, abnormal efficiency or pressure fluctuation.
A complete hydraulic test does more than “show a curve”. It also has to keep the test record.
A digital hydraulic test bench stores parameters, raw data, performance curves and results together, then generates a report for R&D, quality inspection, factory release and later traceability.
A full performance curve describes a hydraulic component much more completely than a handful of rated-point readings.
Manufacturers can use it to judge whether performance meets the design. R&D teams can study efficiency, stability and trends. Quality teams get a more complete test record for every unit.
As a result, modernHydraulic Test Benchare evolving from simple parameter checkers into platforms for automatic control, data acquisition, performance analysis and digital reporting.
With the right hardware, sensors and software, test plans can be built for pumps, motors, valves and complete hydraulic systems, and the bench can be customized to the product and the test.
Company milestones and developments across the hydraulics industry.
We focus on hydraulic products and support for mining equipment. Contact us and we will match you with the right technical support.
Room 301, Building 1, No. 553 Shanwanghe Road, Qingdao Free Trade Zone, Shandong, China
Monday–Saturday, 8:00–17:00